


As microservices become more prevalent in modern software development, it's essential to have a reliable way to monitor their performance and gather metrics. One popular solution for monitoring microservices is Prometheus, an open-source monitoring and alerting system. In combination with Grafana, a popular data visualization tool, Prometheus provides a powerful solution for monitoring microservices at scale.
In this blog post, we'll walk through how to scrape metrics from a Java microservice in Prometheus using a Java exporter, and then display those metrics in a Grafana dashboard. We'll use a simple Spring Boot microservice as an example, but the concepts we cover can also be applied to other Java microservices.
Here are the steps we'll cover:
Setting up Prometheus: We'll start by setting up a Prometheus server and configuring it to scrape metrics from our microservice.
Adding a Java exporter: Next, we'll add a Java exporter to our microservice code to expose the metrics we want to monitor. We'll use the official Prometheus Java client library to create custom metrics for our microservice.
Configuring Grafana: Once we have metrics flowing into Prometheus, we'll configure Grafana to display those metrics in a dashboard.
Setting up Prometheus
First, make sure that you have Minikube installed and running on your local machine. You can follow the official Minikube documentation to install and configure Minikube. If you are using some managed Kubernetes service, you can skip this step.
To deploy Prometheus to your Minikube cluster, we'll be using Helm, a package manager for Kubernetes. Make sure you have Helm installed on your local machine. If you haven't installed Helm yet, you can follow the step-by-step guide in this blog post to install Helm and familiarize yourself with Helm charts.
Next, we'll install Prometheus using the Helm package manager. Helm is a popular tool for managing Kubernetes applications and makes it easy to install, upgrade, and configure complex applications like Prometheus.
To install Prometheus using Helm, run the following command:
helm install kube-prometheus-stack prometheus-community/kube-prometheus-stack
This command will install the kube-prometheus-stack chart from the prometheus-community repository. The kube-prometheus-stack chart includes Prometheus, Grafana, Alertmanager, and other related tools.
- After the installation is complete, you can verify that Prometheus is running by checking the status of the Prometheus deployment and service:
kubectl get deployment
kubectl get svc
These commands should return the status of the Prometheus deployment and service, respectively. The service should be exposed on a NodePort, which you can use to access the Prometheus web UI.

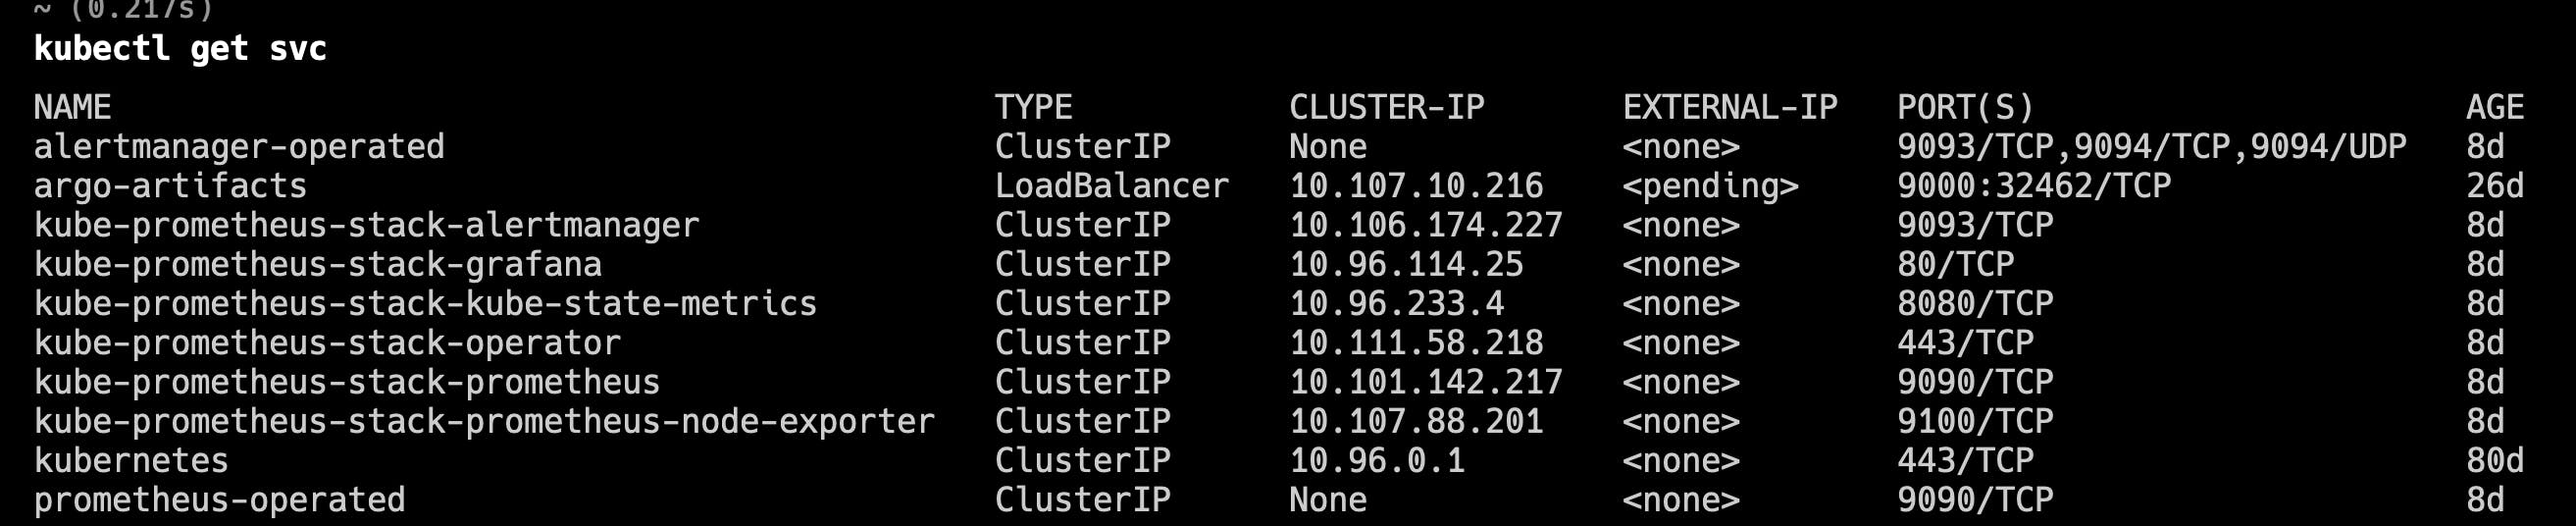
When Prometheus is deployed using this Helm chart, it automatically discovers and monitors services in the Kubernetes cluster based on the labels assigned to them.
By default, the Helm chart sets the release label to the name we defined, which in this case is "kube-prometheus-stack". Prometheus will use this label to discover and scrape metrics from the services associated with that label.
Adding a Java exporter
Next, we'll add a Java exporter to our microservice code to expose the metrics we want to monitor. We'll utilize the official Prometheus Java client library and configure our Spring Boot application to export these metrics.
First, make sure you have the necessary dependencies in your project's pom.xml file:
<dependencies>
    <!-- ... -->
    <dependency>
        <groupId>io.micrometer</groupId>
        <artifactId>micrometer-registry-prometheus</artifactId>
        <scope>runtime</scope>
    </dependency>
    <!-- ... -->
</dependencies>
The micrometer-registry-prometheus dependency provides the required functionality to export metrics in a format compatible with Prometheus.
Next, let's dive into the process of adding a Java exporter to your microservice code. This will allow us to create custom metrics using the Prometheus Java client library and increment them with each request made to the microservice. We'll use a simple example with a HelloWorldController class to illustrate this.
The HelloWorldController is a basic Spring Boot controller that serves as an entry point for handling HTTP requests. In our case, it will act as a starting point for adding custom metrics to monitor our microservice. By following this example, you'll be able to adapt and extend it to meet your specific monitoring needs.
Let's start by modifying the HelloWorldController class:
import org.springframework.web.bind.annotation.GetMapping;
import org.springframework.web.bind.annotation.RestController;

import io.micrometer.core.instrument.Counter;
import io.micrometer.core.instrument.MeterRegistry;

@RestController
public class HelloWorldController {

    private Counter visitCounter;

    public HelloWorldController(MeterRegistry registry) {
        visitCounter = Counter.builder("visit_counter")
            .description("Number of visits to the site")
            .register(registry);
    }

    @GetMapping("/")
    public String index() {
        visitCounter.increment();
        return "Hello World!";
    }
}
In this example, we've added a custom metric called visit_counter to the HelloWorldController. The metric is of type Counter, which represents a continuously increasing value. We use the Counter.builder() method to define the metric and provide a description for it. The metric is then registered with the provided MeterRegistry instance in the controller's constructor.
Additionally, we've added an index() method that handles requests to the root path ("/"). Inside this method, the visitCounter metric is incremented using the increment() method. This allows us to track the number of visits to the site.
To enable the Prometheus metrics endpoint in your Spring Boot application, ensure that the following properties are set in your application.properties file:
# application name
spring.application.name=springboot-example

# Enable Actuator endpoints
management.endpoint.metrics.enabled=true
management.endpoints.web.exposure.include=*
management.endpoint.prometheus.enabled=true
management.prometheus.metrics.export.enabled=true

# Set the application tag for metrics
management.metrics.tags.application=${spring.application.name}
These configuration properties enable the necessary Actuator endpoints, including the /actuator/prometheus endpoint, which will expose the metrics in a format compatible with Prometheus. The management.metrics.tags.application property sets the application tag for the metrics, which can be customized as per your requirements.
Once you've made these changes, rebuild and redeploy your Spring Boot application. The Java exporter will now export the visit_counter metric, and Prometheus will scrape this metric from the /actuator/prometheus endpoint of your application.
Dockerizing the Spring Boot Application
To containerize our Spring Boot application, we'll use Docker. Docker allows us to package our application along with its dependencies into a container, making it portable and easy to deploy.
First, let's create a Dockerfile to define the containerization process:
FROM maven:3.9.1-amazoncorretto-20 as builder

COPY src /home/app/src
COPY pom.xml /home/app

RUN mvn -f /home/app/pom.xml clean test package

FROM amazoncorretto:20.0.1-al2

WORKDIR /home/app

COPY --from=builder /home/app/target/*.jar app.jar

EXPOSE 8080

ENTRYPOINT ["java","-jar","app.jar"]
In the Dockerfile, we have defined a multi-stage build. In the first stage, we use the Maven image to build our Spring Boot application. We copy the source code and the pom.xml file to the container and execute the Maven build commands to compile and package the application.
Then, in the second stage, we use the Amazon Corretto image as our base image. We set the working directory to /home/app and copy the built JAR file from the previous stage (--from=builder) into the container as app.jar.
We expose port 8080, which is the default port for our Spring Boot application. Finally, we set the ENTRYPOINT to run the application using the java -jar command.
Once you've made these changes, rebuild and redeploy your Spring Boot application. The Java exporter will now export the visit_counter metric, and Prometheus will scrape this metric from the /actuator/prometheus endpoint of your application.
With the Java exporter successfully added to your microservice code, you can now move on to visualizing and analyzing the metrics in your Grafana dashboard.
As a convenience, you can also use the Docker image theswarnim/springboot-example:latest that already includes this example. This image can be pulled and used directly.
For further exploration, you can check the full source code from the GitHub repository, which contains not only the Java Spring Boot example but also showcases examples using Golang and MongoDB.
Configuring Grafana
To display the metrics collected by Prometheus in a visually appealing and customizable dashboard, we'll configure Grafana. In our setup, we have already deployed the Prometheus and Grafana components using the prometheus-community/kube-prometheus-stack Helm chart. This chart comes preconfigured with a Grafana dashboard.
Let's begin by leveraging the existing setup and connecting our Spring Boot application's metrics to Grafana.
- Deploy the
springboot-exampleservice using a Deployment and create the corresponding Service. Create a file namedspringboot-example.yamland paste the following content:
apiVersion: apps/v1
kind: Deployment
metadata:
  name: springboot-example-deployment
  labels:
    app: springboot-example
spec:
  replicas: 1
  selector:
    matchLabels:
      app: springboot-example
  template:
    metadata:
      labels:
        app: springboot-example
    spec:
      containers:
        - name: springboot-example
          image: theswarnim/springboot-example:latest
          ports:
            - containerPort: 8080
---
apiVersion: v1
kind: Service
metadata:
  name: springboot-example-service
  labels:
    app: springboot-example
spec:
  selector:
    app: springboot-example
  ports:
    - name: http
      protocol: TCP
      port: 8080
      targetPort: 8080
Apply the configuration using the following command:
kubectl apply -f springboot-example.yaml
- Now, we will deploy ServiceMonitor
prometheus-springboot-example-service-monitorin the cluster. This ServiceMonitor is responsible for scraping the metrics from our Spring Boot application. Create a file namedservice-monitor.yamland paste the following content:
apiVersion: monitoring.coreos.com/v1
kind: ServiceMonitor
metadata:
  name: prometheus-springboot-example-service-monitor
  labels:
    release: "kube-prometheus-stack"
spec:
  endpoints:
    - port: http
      interval: 30s
      scrapeTimeout: 10s
      path: "/actuator/prometheus"
  namespaceSelector:
    matchNames:
      - default
  selector:
    matchLabels:
      app: springboot-example
Apply the ServiceMonitor configuration using the following command:
kubectl apply -f service-monitor.yaml
Prometheus uses the
release: "kube-prometheus-stack"label to identify and connect with the ServiceMonitor. With the ServiceMonitor in place, Prometheus will automatically scrape the metrics from our Spring Boot application.To find the Grafana service, use the following command:
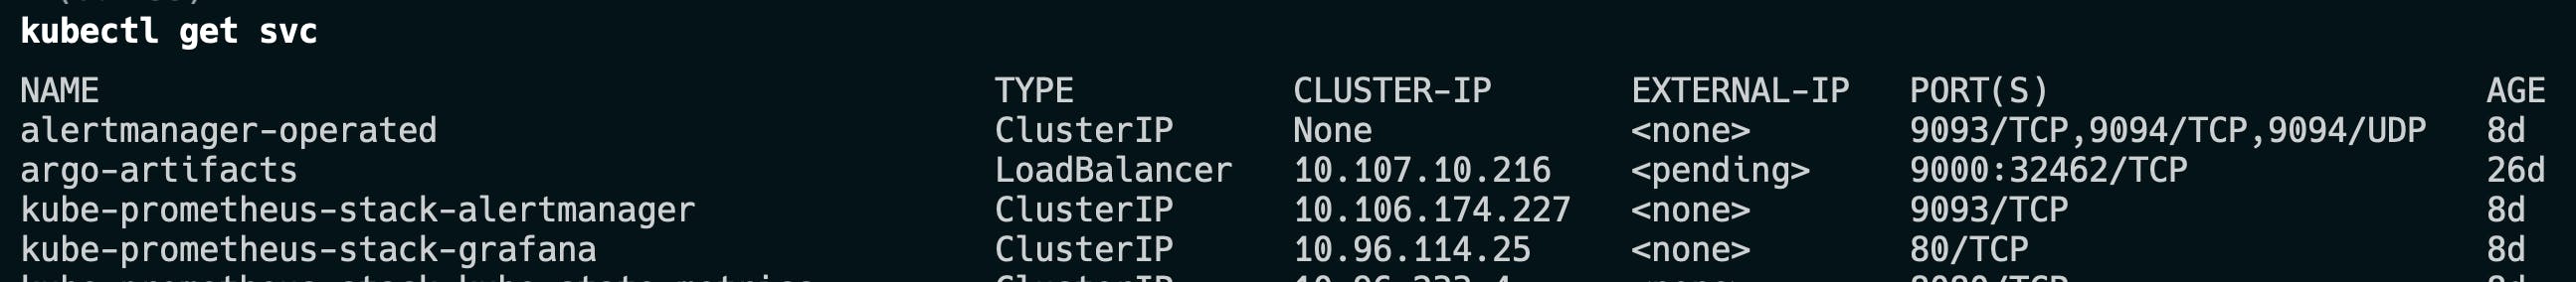
kubectl get svc
Look for the service named kube-prometheus-stack-grafana in the output. The Grafana service runs on port 80.
- Port-forward the Prometheus service to access the Prometheus dashboard. Run the following command:
kubectl port-forward svc/kube-prometheus-stack-prometheus 9090:9090
This command forwards port 9090 on your local machine to the Prometheus service.
Open your web browser and navigate to
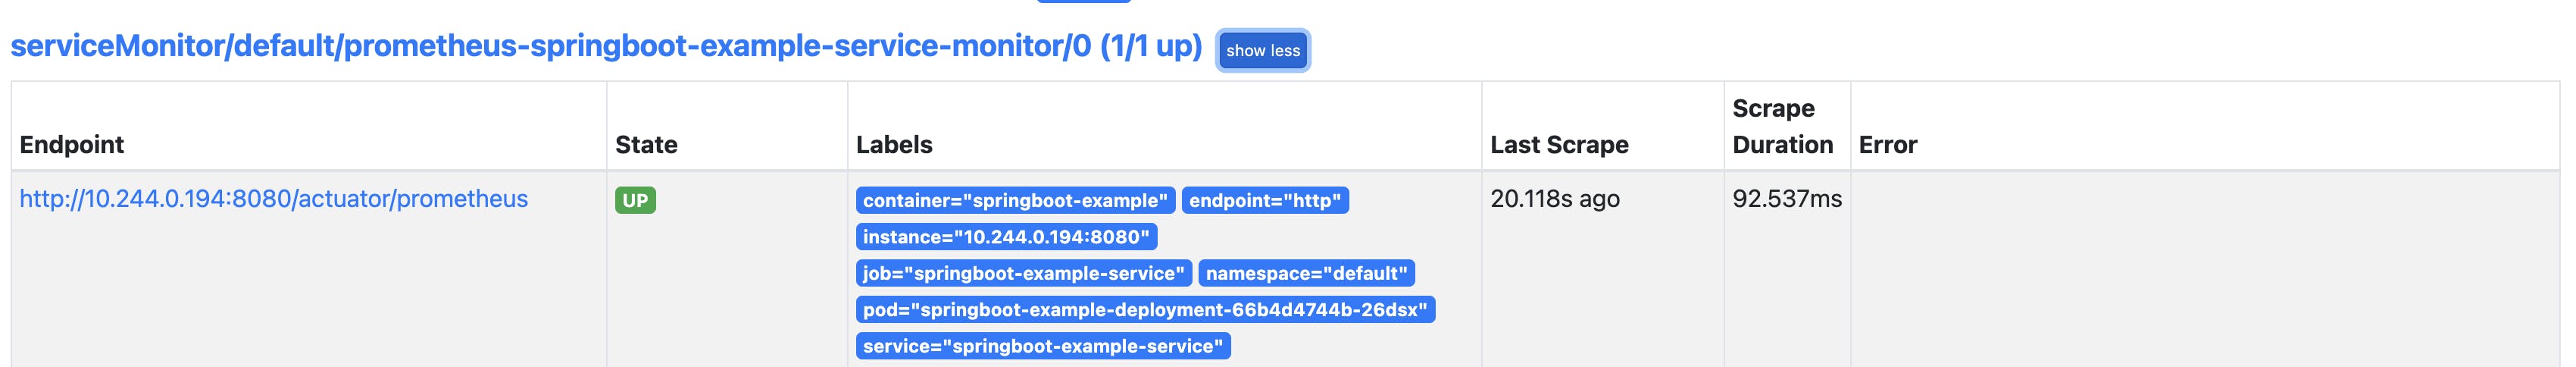
http://localhost:9090to access the Prometheus dashboard.On the Prometheus dashboard, click on the "Status" dropdown menu and select "Targets" to verify the presence of the
prometheus-springboot-example-service-monitorServiceMonitor. Ensure that the target for this ServiceMonitor is in the "UP" state. This indicates that Prometheus is successfully scraping metrics from your Spring Boot application.
- If the prometheus-springboot-example-service-monitor target is present and in the "UP" state, you can proceed to port-forward the Grafana service. Run the following command:
kubectl port-forward svc/kube-prometheus-stack-grafana 3000:80
This command forwards port 3000 on your local machine to port 80 of the Grafana service.
Open your web browser and navigate to
http://localhost:3000to access the Grafana dashboard.Once you've accessed the Grafana dashboard, follow these steps to import the JVM Micrometer dashboard:
Click on the "+" icon in the left sidebar and select "Import."

In the "Import via grafana.com" section, provide the dashboard ID
4701and click "Load."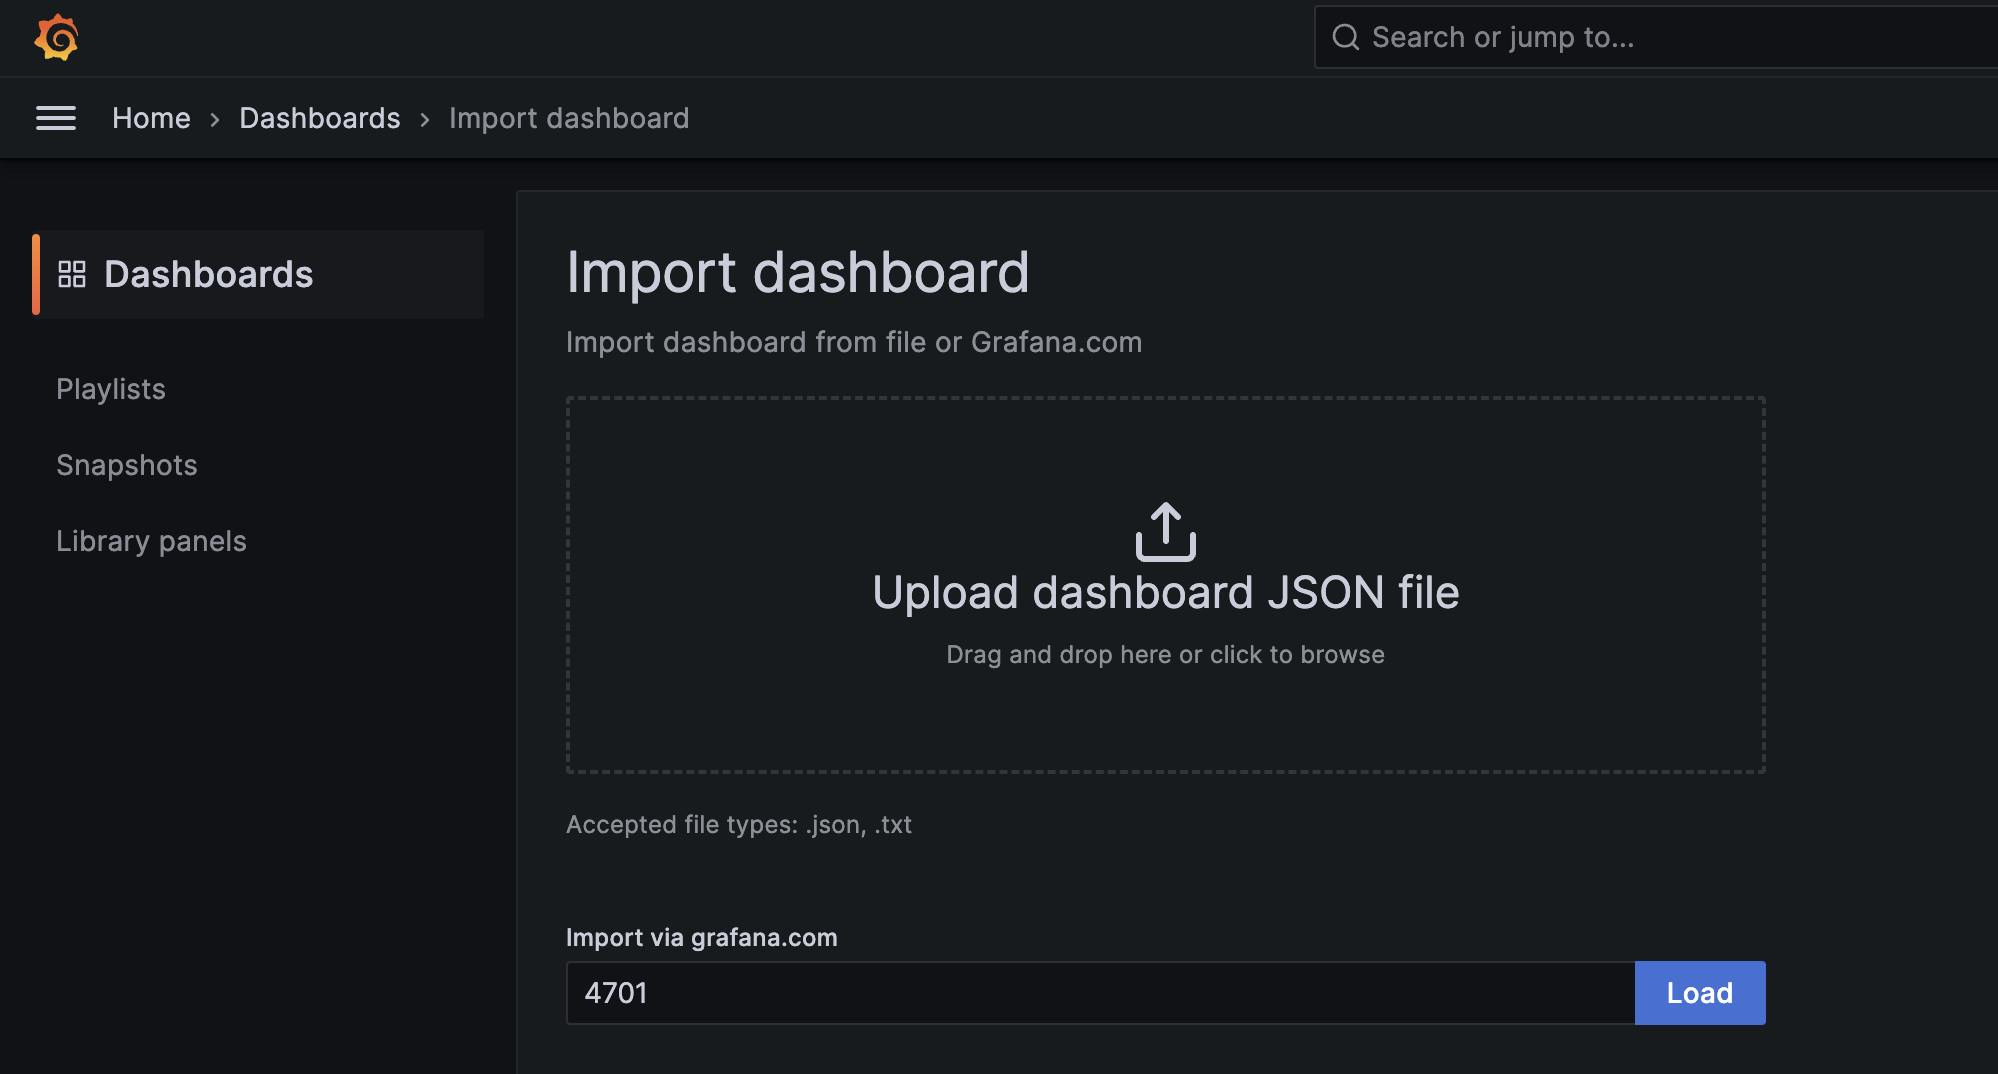
By following these steps, you'll configure Grafana to display the metrics collected by Prometheus from your Spring Boot application. The JVM Micrometer dashboard provides comprehensive insights into the performance and behavior of your Java microservice.

Once you've accessed the Grafana dashboard and imported the JVM Micrometer dashboard, you can customize it to include the specific metrics you want to monitor. Let's add the
visit_countermetric tile to the Grafana dashboard:Click on the "Add" button at the top of the dashboard to enter the edit panel mode.

In the edit panel mode, you can add new panels to the dashboard. To add the
visit_countermetric, follow these steps:a. In the "Metrics" tab, select the Prometheus data source and enter the query for the
visit_countermetric. For example, you can use the query:visit_counterorsum(visit_counter)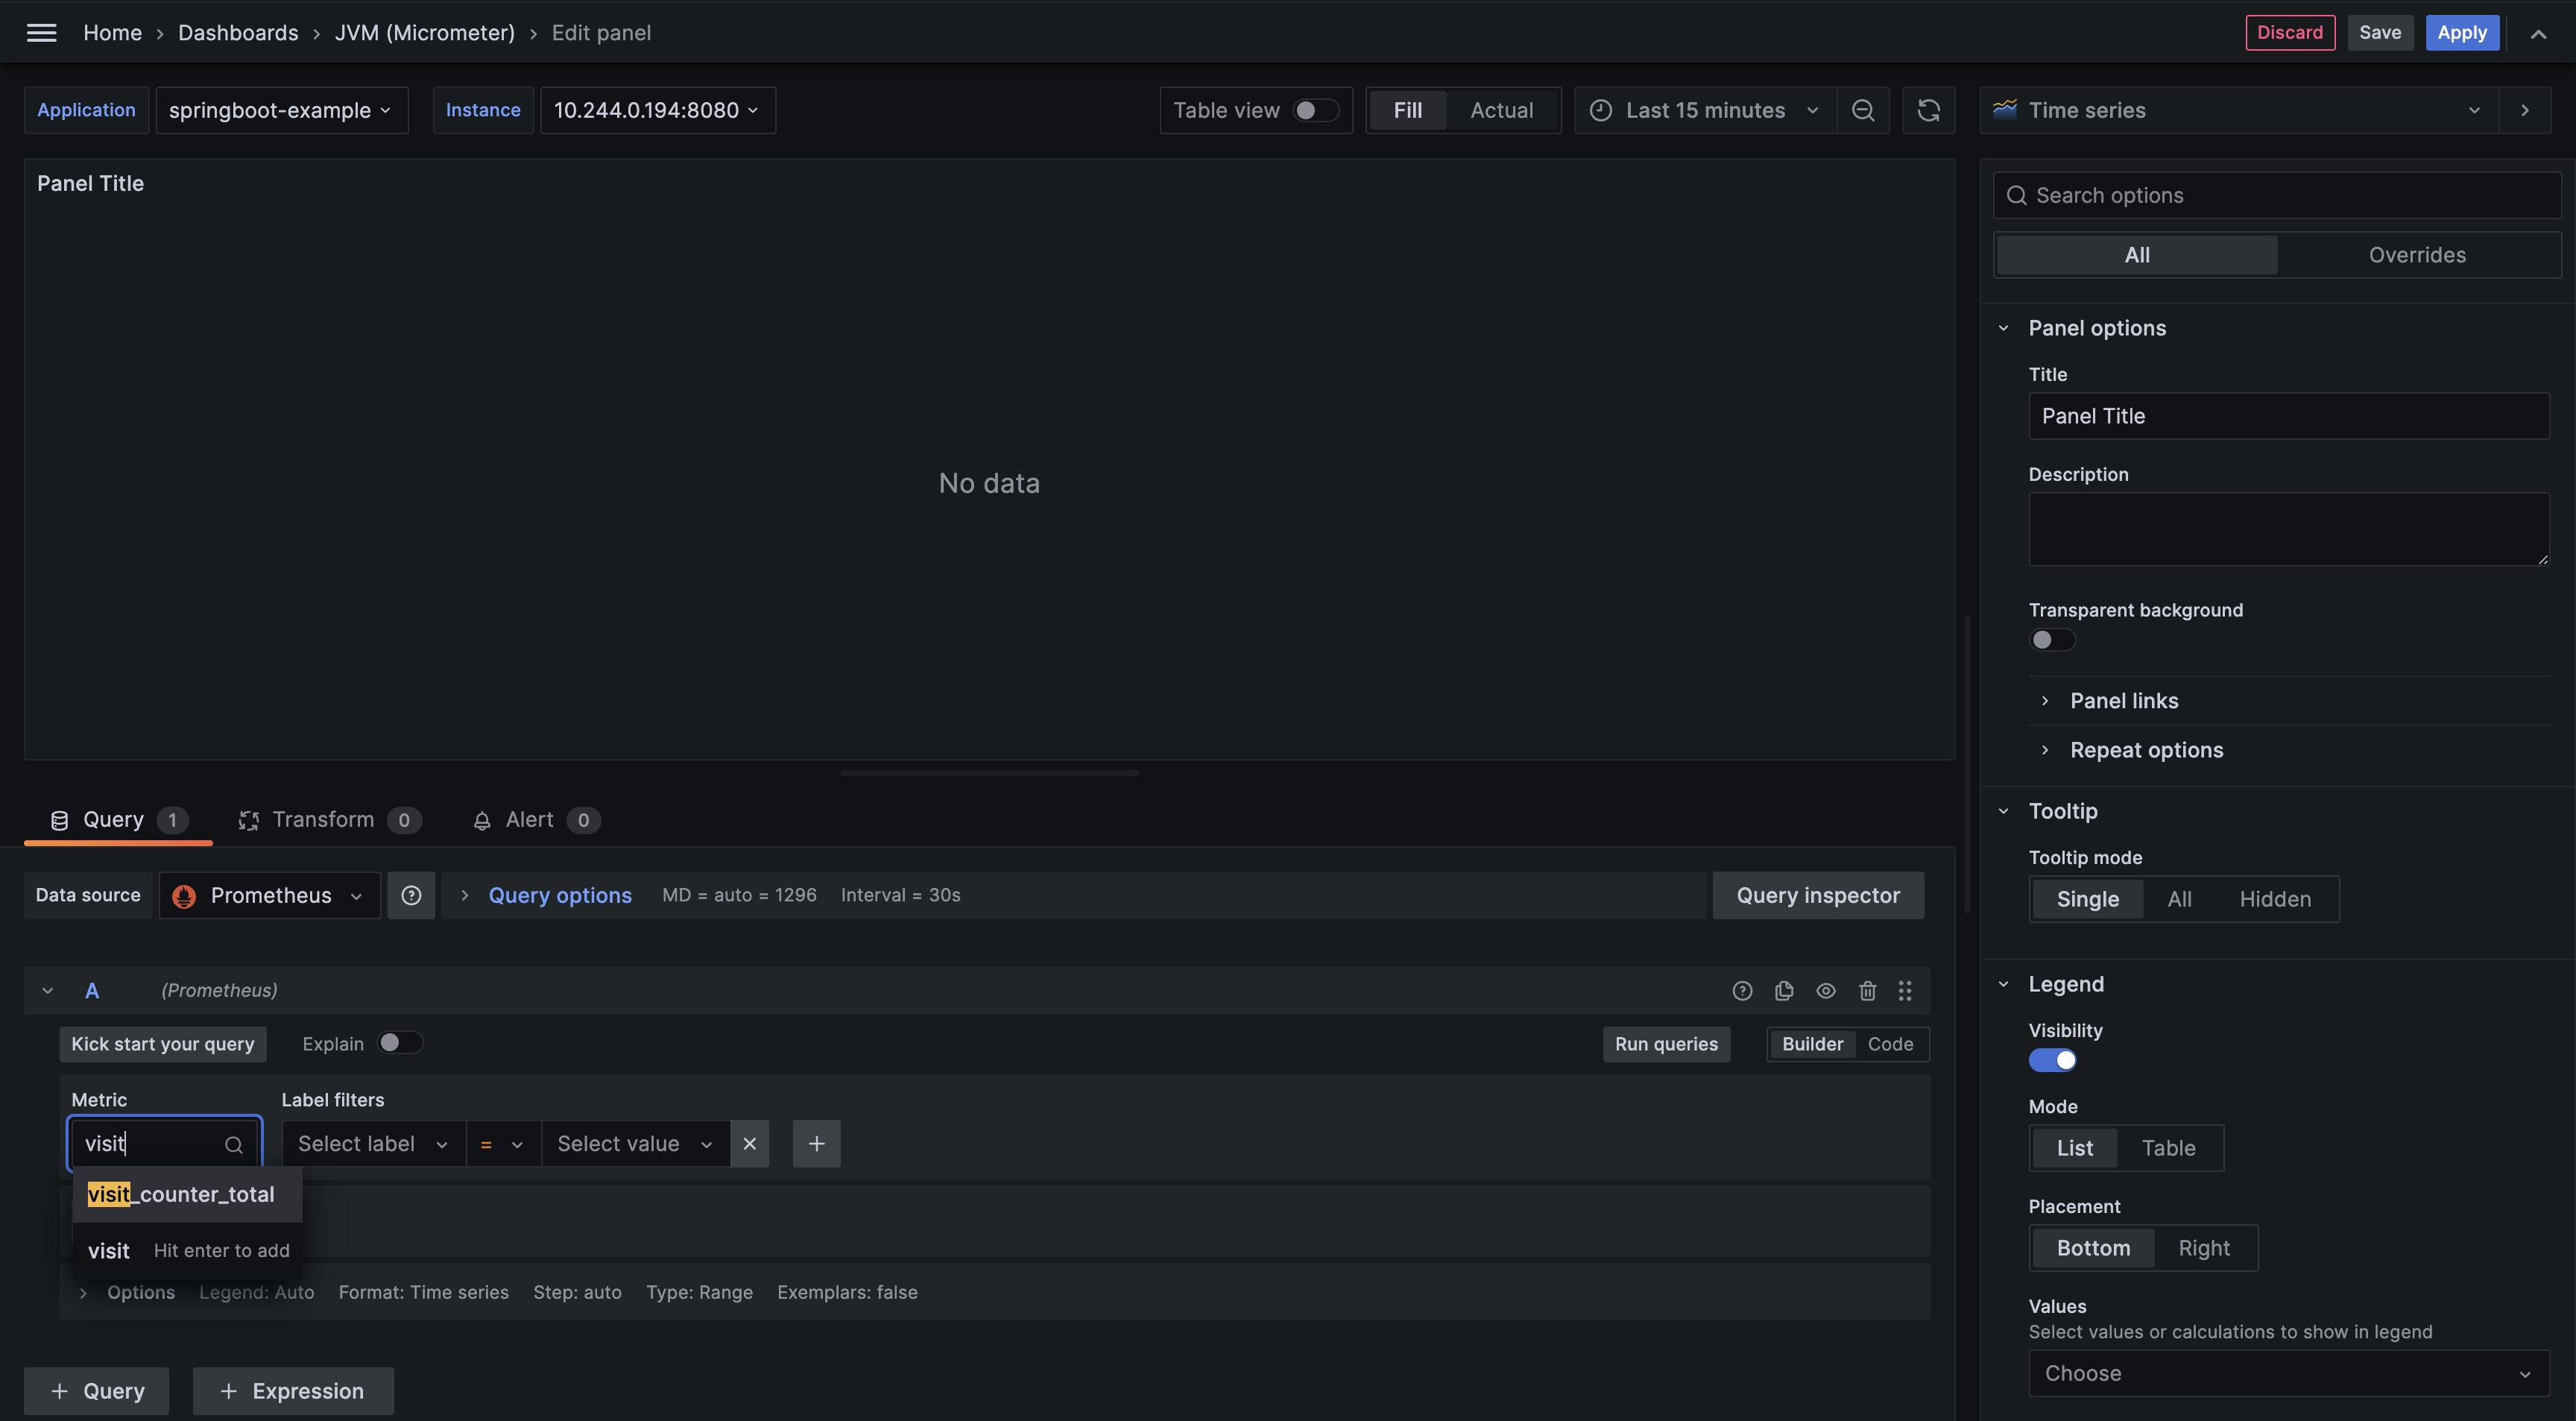
b. Click on the "Apply" button to save the panel.
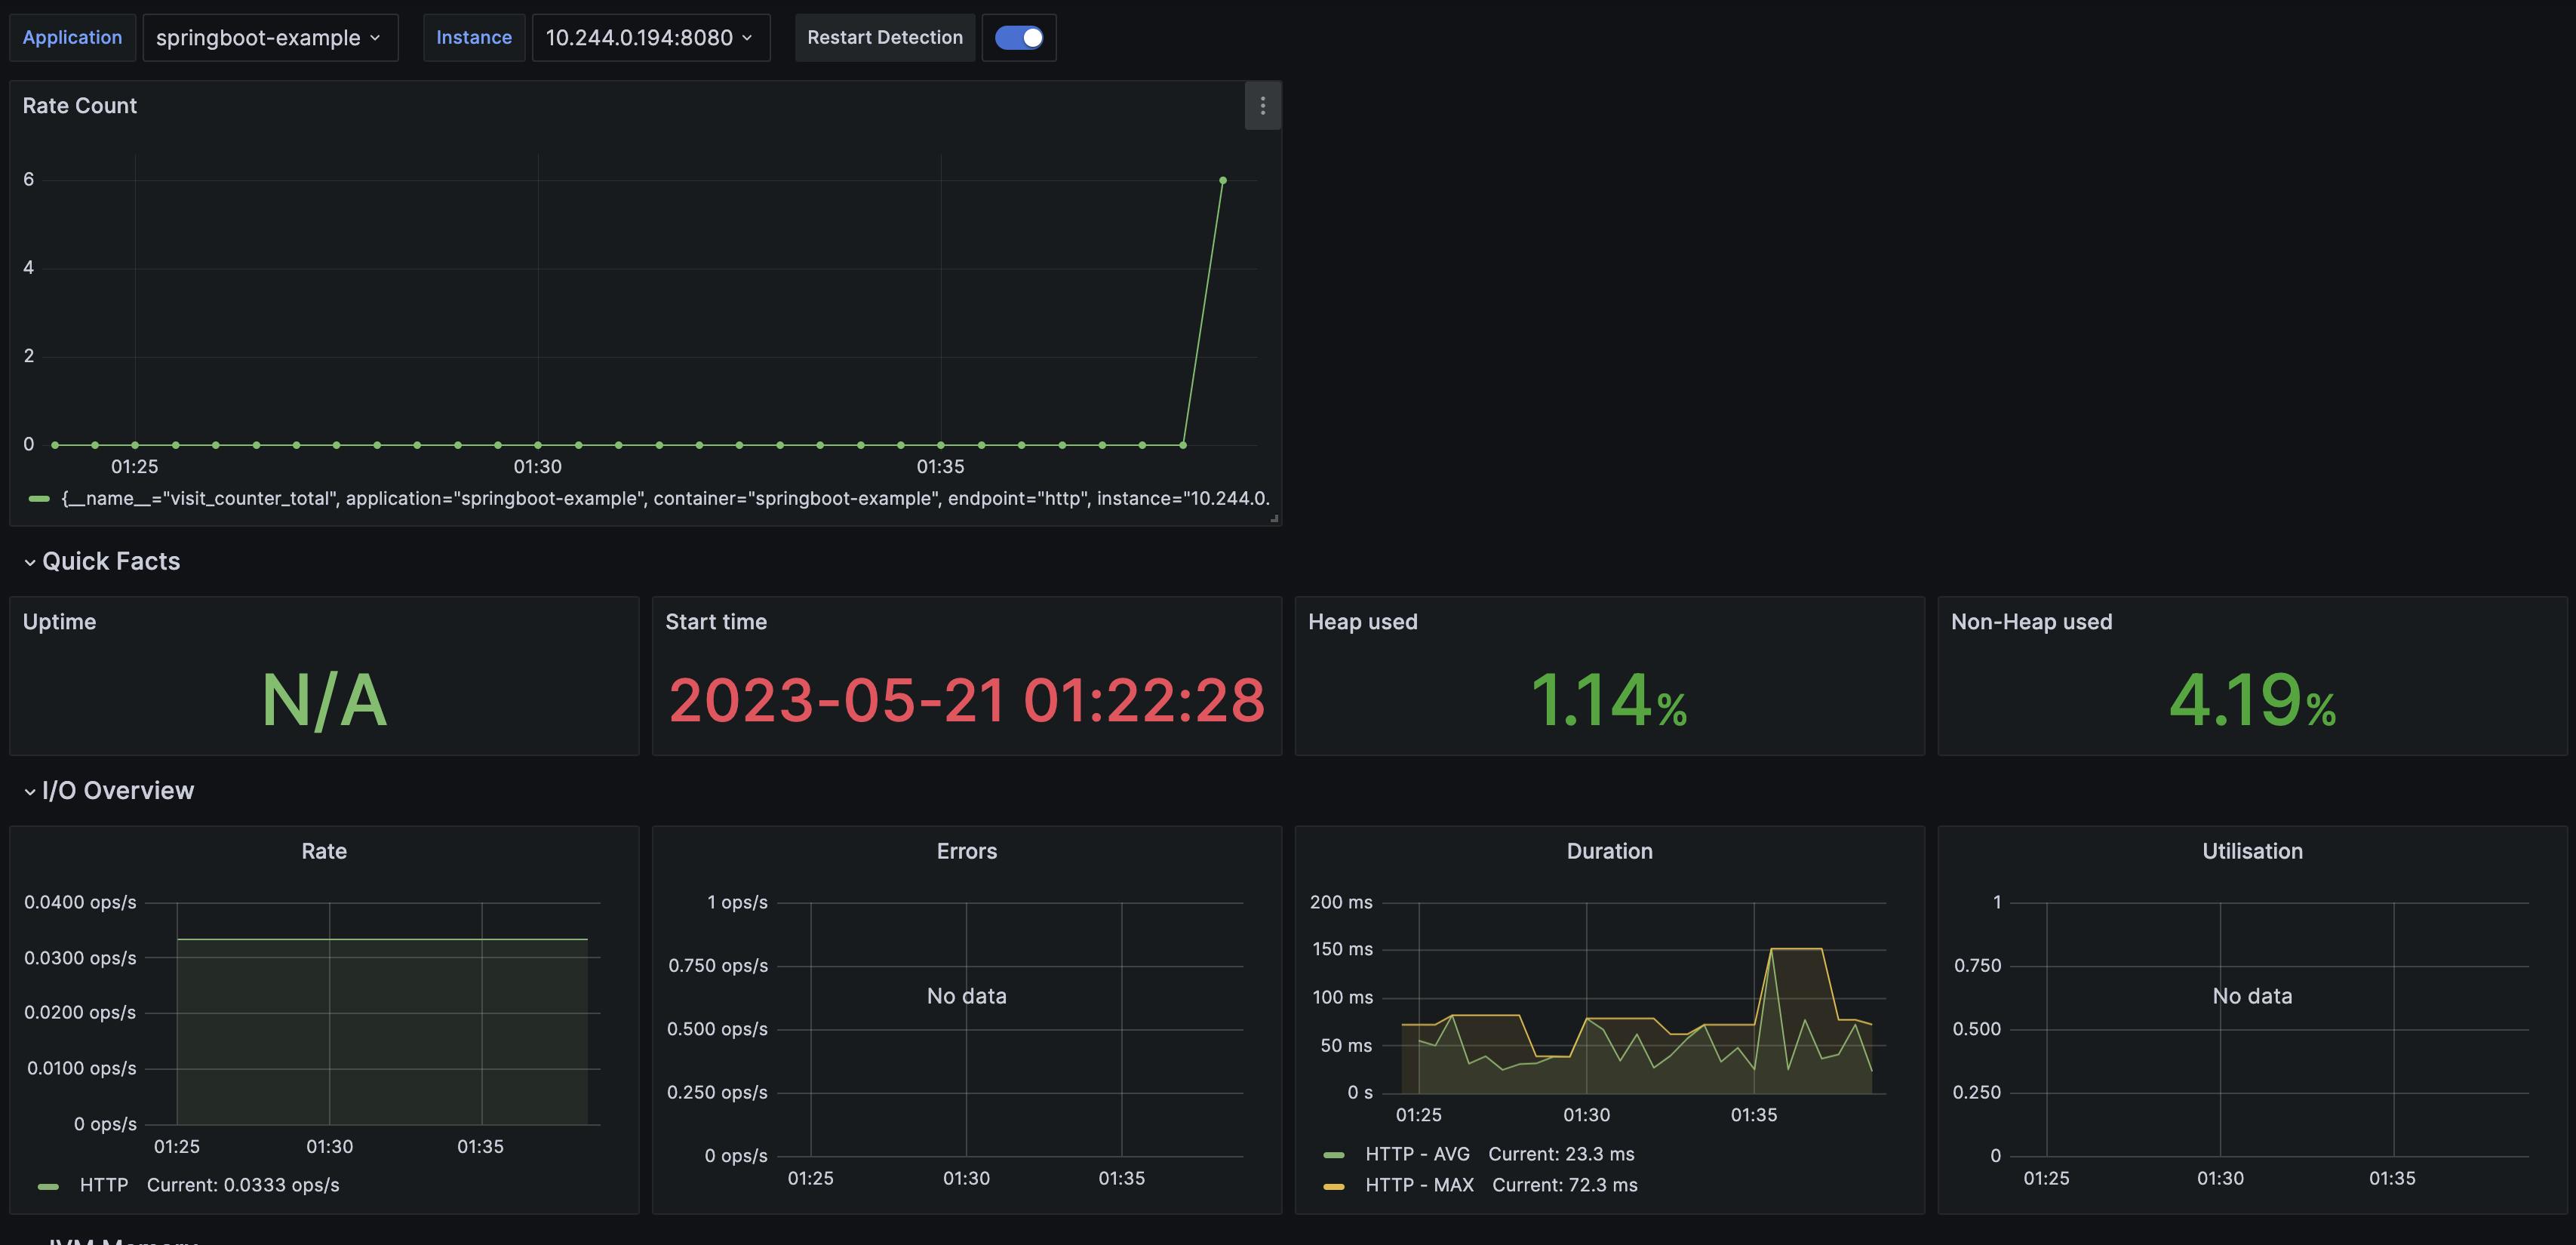
Now, the Grafana dashboard will include the visit_counter metric tile, which displays the number of visits to your microservice.
Feel free to explore further customization options in Grafana, such as adding additional panels, adjusting time ranges, setting up alerts, or creating new dashboards to suit your specific monitoring needs.
Remember to save your changes in Grafana if you want them to persist across sessions.
Note: The steps provided here are a general guidelines, and the actual process may vary depending on the version of Grafana you are using. Refer to the Grafana documentation for more detailed instructions on customizing dashboards and panels.
With the visit_counter metric tile added to your Grafana dashboard, you can now easily monitor and analyze the number of visits to your microservice in real time.